
Description
The most common method for resolving a disruption claim is measured mile analysis. This methodology compares the productivity achieved in areas or periods affected by disruptive events with the productivity achieved in similar activities during periods not affected by those events.
Measured Mile Analysis seeks to establish the contractor's productivity level during periods not impacted by disruptive events. Once established, it is compared with the impacted productivity in order to calculate the damages caused.
It is essential that the comparison is between similar activities. It would not be an acceptable analysis to compare the productivity of cutting a plate with welding that same plate, because they are completely different activities. This type of analysis is usually somewhat simpler and widely accepted in linear projects such as roads, railways, pipelines and cabling. It is also applicable when the work is quite repetitive, such as earthworks.
Limitations
It is the most robust analysis because it does not take planned productivity, or budgeted units, into account, but uses only actual project progress. However, it has several limitations that may make its use unviable.
- There must be an area or period not affected by any event.
- The period must be long enough.
- The activities compared must be similar.
- Contemporary, detailed and reliable information must exist.
This is a complex analysis because it is common for the same event to affect several activities differently and in different periods. At the same time, some activities are affected by several events whose responsibility is not always clearly defined. Applying measured mile analysis is impossible without reliable and detailed contemporary information.
The claiming party, usually the contractor, bears the burden of proving the causal relationship between the events and the delay or loss of productivity. Therefore, it is the party most interested in generating and maintaining all possible information about project progress.
Example
Assume a project whose tender and contract were based on a geological study carried out by the owner. The contractor must excavate a trench. In the first section, the ground matches the results of the geological study; however, in the second section large quantities of rock appear. Measured mile analysis could be applied to determine the contractor's loss of productivity due to conditions not contemplated in the study carried out by the client.
To carry out a disruption analysis, the first step is to identify those events or situations that, being outside the contractor's scope, have affected productivity. Once the events and affected activities have been identified, the actual productivity of that work must be analysed.
The following chart shows the cumulative progress of a specific activity in blue and the percentage progress per week in red, used here as an indicator of productivity. Progress is based on actual quantities completed, such as cubic metres excavated, linear metres installed or inches welded, relative to the total scope of the activity.
This example assumes the same resources and the same number of man-hours each week. Less weekly progress with the same hours therefore indicates lower productivity. It is useful to distinguish man-hours consumed per unit of work, which increase when productivity falls, from output in units of work per man-hour, which is the reciprocal measure.
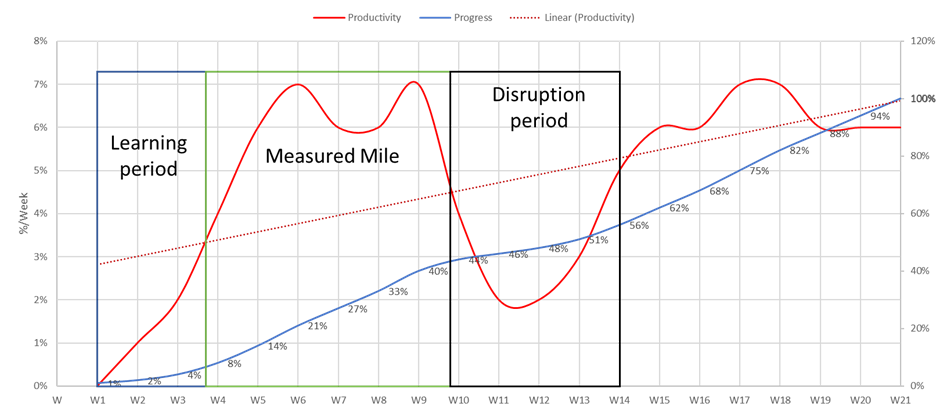
A low productivity index is evidence of an increase in the cost of carrying out the work. Several reasons can affect productivity, so it must be analysed in detail whether the identified events caused the decrease in productivity. This method makes it possible to identify periods of time in which the activities were probably affected by an event.
In this case, between week 10 and week 14, productivity fell below the trend line. Excluding the first weeks of adaptation and learning, the average productivity of the period between week 4 and week 10, not impacted by any event, is the measured mile.
If an event outside the contractor's scope is identified that may have caused the decrease in productivity, the difference between the average productivity established in the non-disrupted period and the productivity of the impacted period can be claimed.