
To assess the quality of project planning, it should be reviewed from both a qualitative and a quantitative perspective.
A qualitative assessment of planning quality is based on subjective criteria. Examples include activity grouping (WBS), activity descriptions, number of activities, resource assignment, logical construction sequence and whether it fits the reality of the project. The last of these is the most important, because without realistic planning it is not possible to assess the real impact of different strategies or calculate the impact of a specific event.
A quantitative assessment of planning quality is based on measurable criteria derived from industry best practices.
There is a set of checkpoints known as the DCMA 14-Point Assessment (DCMA-14), defined by the U.S. Defense Contract Management Agency. They are not necessarily rigid rules, but these indicators show how coherent a schedule is and highlight potentially problematic areas of the plan. This assessment provides a way to check planning quality objectively. Although satisfying these guidelines does not necessarily mean that the schedule is feasible, failing to satisfy them is a guarantee that it is not.
1. Task logic
Every task must have a predecessor and successor activity except the first and last activity, corresponding to the notice to proceed (NTP) milestone and the project finish milestone.
A task without a predecessor will not move with the rest of the activities if there is a delay, which can lead to material deliveries or resource arrivals, with the cost that implies, when the real start date should be later.
The DCMA recommendation is that no more than 5% of planned activities should be missing a predecessor or successor at any given time.
2. Negative lags
Negative float appears in a schedule when the target completion date cannot be achieved due to changes in the construction sequence or delays that have occurred on the project. However, in this case the meaning of negative lag is the one between two tasks where the successor starts a few days before the predecessor finishes.
Negative lags should not be accepted in any schedule. The correct practice is to break activities down to a level of detail where traditional FS or SS relationships can be used. DCMA states that tasks should not be planned with negative lags.
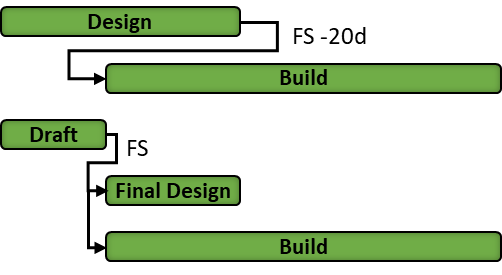
3. Delays (positive lags)
Delays or offsets at the start of activities should be avoided because they can negatively affect critical path analysis. They can also create confusion if the reasons for using them are not perfectly justified.
Instead of adding a lag at the start of a certain activity, it is recommended to represent that time through another activity. For example, if several days must be allowed for foundations to cure before the next activity can begin, that curing time should be represented as an independent task.
DCMA sets the limit at 5% of relationships with positive lag.
4. Relationship types
There are basically four types of relationships:
- FS (Finish to Start)
- SS (Start to Start)
- FF (Finish to Finish)
- SF (Start to Finish)
The ideal relationship between project tasks or activities is the Finish-to-Start relationship, because it defines a clear sequence and produces a critical path that is easy to understand.
DCMA states that at least 90% of all relationships between tasks should be Finish-to-Start. There may be specific cases where Finish-to-Finish and Start-to-Start relationships are appropriate, although they should be kept to a minimum. If more than 10% of relationships are of this type, it is recommended to evaluate the level of detail of the schedule.
5. Hard constraints
Constraints allow the start or finish of an activity to be scheduled without considering existing relationships. It is preferable for dates to be the natural result of dependencies and activity durations.
If constraints are necessary, soft constraints such as Start No Earlier Than should be used, because they allow the date to remain logic-driven. Mandatory constraints should never be used, because they have maximum priority and therefore override all relationships and calendars.
The threshold proposed by DCMA for hard constraints is that they should not exceed 5% of the planned, not-yet-executed activities in the project schedule.
Ideally, there should be no hard constraints in the activity schedule. It is more advisable to use deadlines or float on schedule dates to represent contractual or other commitment dates that must be considered as firm commitments.
6. Maximum float.
Planning software can calculate total float for all activities. Activities on the critical path will have 0 days of float. DCMA defines the maximum acceptable float as 44 days because activities with such large float are often the result of missing dependencies between activities.
No more than 5% of activities should exceed the maximum float.
7. Negative float.
Negative float occurs when the project schedule is planned with a deadline date or when hard constraints artificially modify the date calculation. Negative float should not be present in any project activity.
8. Maximum float duration.
DCMA limits to 5% the number of activities with total float greater than 44 working days, approximately two months. If activities have very large total float, they are probably not properly linked, resulting in unstable logic.
Tasks or activities planned with float greater than 44 days make it difficult to objectively estimate resources and assess performance against both the schedule and the planned cost.
9. Invalid dates
An activity is considered to have an invalid date when its start or finish has been planned outside the project calendar. For example, if Sundays are not considered working days, it makes no sense for the planned start date of a task to be a Sunday. The same applies to dates after project completion.
All projects must clearly define the execution calendar, taking into account the different contractors and work fronts, as these can differ considerably. The following must be defined:
- Working days.
- Holidays or non-working days, which may change depending on the country.
- Working hours, which may be 8 hours, 10 hours, 12 hours or 24 hours depending on how many shifts are worked.
No invalid date should be allowed.
10. Resources
To carry out any activity, some resource must be used or consumed, whether human resources (man-hours), material resources (units, m3) and/or machinery and tools.
Depending on the nature of the activity, it will include one, some or all of the resources mentioned above. Ideally, every task should have some resource assigned.
11. Missed tasks.
This represents the percentage of tasks not completed on time compared with the date defined in the baseline for those same activities. It could be considered a measure of how late a project is compared with its baseline. The DCMA threshold for missed tasks is 5%.
12. Critical path test
The critical path is defined as the sequence of activities with zero delay margin, or float. Therefore, the critical path is the longest continuous sequence of activities in the project, meaning that a delay to any activity on it results in a delay to the project completion date.
Once the critical path has been identified, float is intentionally introduced into the schedule by applying a major change to the remaining duration of an activity on the critical path. For the test to be passed, project completion must also be delayed and there must be no negative float.
13. Critical Path Length Index (CPLI)
The Critical Path Length Index (CPLI) is a measure of the efficiency of the planned schedule and indicates how realistic the project finish date is.
It is defined as the sum of the remaining project duration (the number of planned working days on the current critical path) and total float, divided by the project duration. In this case, total float is the difference between the planned finish date and the baseline project finish date.
DCMA considers a CPLI below 0.95 to be an indicator of a potential planning problem or deviation that should be studied.

14. Baseline Execution Index (BEI)
The Baseline Execution Index (BEI) is another indicator that helps understand how well tasks are being executed compared with the baseline. It measures the performance with which the project team is completing tasks.
It is calculated by dividing the total number of completed tasks by the total number of tasks that should have been completed according to the baseline at that data date. A BEI below 0.95 indicates a potential problem that must be analysed.