
Earned Value Analysis (EVA) is a technique for measuring project progress against what was planned and budgeted. It compares the completed work, or earned value, with the planned work, or planned value, and the cost incurred, or actual cost. It provides simple indicators that help determine whether the project is on time and within budget.
Earned Value Management (EVM) earned value management basics is an integrated project management approach that combines scope, schedule and cost analysis. It is based on the principles of Earned Value Analysis, but covers a broader set of processes and practices. Earned Value Management provides a systematic method to plan, track and analyse project progress, cost and performance.
Earned value analysis can be used prospectively to obtain a realistic forecast of project time and cost, or retrospectively to analyse disruption suffered up to a given date.
To understand earned value formulas, the following concepts must first be defined:
- Planned Value (PV): the approved budget for completing work by a given date.
- Earned Value (EV): the approved budget for the work actually completed by a given date.
- Actual Cost (AC): the actual cost incurred to perform the work actually completed by a given date.
- Schedule Performance Index (SPI): the ratio between the work actually completed (earned value, EV) and the work planned (planned value, PV) by a given date. It measures project time efficiency. A value below 1 indicates that the project is behind the plan.
- Cost Performance Index (CPI): the ratio between the budgeted cost of the actual progress achieved (earned value, EV) and the actual cost by a given date. It measures project cost efficiency. A value below 1 indicates that the project is spending more than planned.
In project management, these performance indicators are used to assess project health.
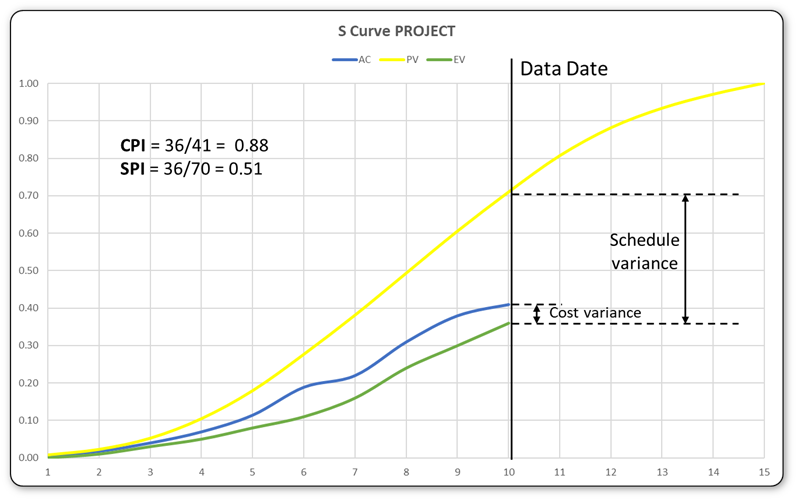
Steps to calculate earned value
- Quantify the work performed or the progress achieved. In an assembly line, the work performed may be measured as the number of completed products. However, determining progress on a construction project is not always straightforward. Depending on the type of project, one measurement method will be more appropriate than another.
- Obtain the total project budget.
- Apply the earned value formula. Earned value equals completed work multiplied by the budget. This formula can be applied to the project as a whole or to individual work packages. When using planning software and realistic cost data is available for each activity, the software can calculate earned value accurately.
Example
Assume a company plans to produce 10 items per week. It is estimated that producing those 10 items requires 12 hours per item. Direct labour costs 20 dollars per hour, with 2,000 dollars of consumables and materials per week. Indirect cost is 1,600 dollars per week. Therefore, the average total cost per hour is 50 dollars, each item costs 600 dollars, and the total cost is 6,000 dollars per week.
Considering a six-day working week, after three days of work 5 items should have been completed. Planned value can therefore be calculated as:
- Planned Value (PV) = Planned Progress % * Budget
- Planned Value (PV) = 50% * 6000 = 3000 dollars
After three days of work, it is found that 3,600 dollars have been spent (AC), but only 3 items have been produced. The earned value is therefore:
- Earned Value (EV) = Actual Progress % * Budget
- Earned Value (EV) = 30% * 6000 = 1800 dollars
- SPI = 30/50 = 0.6
- CPI = 1800/3600 = 0.5
If no action is taken to recover the delay and reduce cost, according to the SPI, producing 10 items will take 6/0.6 = 10 working days. According to the CPI, producing 10 items will cost 6000/0.5 = 12000 dollars.
Earned value analysis for disruption calculation
Disruption refers to a reduction in productivity caused by an unexpected event. In the context of a construction project, disruption occurs when the contractor performs work less efficiently than originally planned. Disruption analysis using earned value can be divided into several steps.
The first step is to collect all relevant information for the period and activities being analysed. With the information obtained, the work curve can be calculated.
The second step is to identify the periods where a disruption event is likely to have occurred. These periods are characterised by a difference between the earned curve and the actual curve. The difference means that the contractor has spent more hours than planned to achieve the same quantity of work.
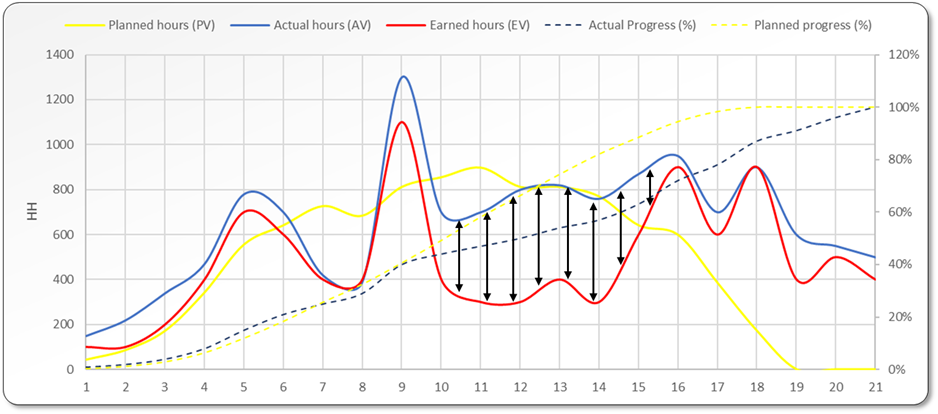
The third step is to identify events outside the contractor's control that may have caused the disruption in the identified periods. If no event is identified, the claim is very unlikely to progress, because the disruption is more likely to be caused by unqualified labour, learning curve effects, material delays, lack of equipment or tools, or simply because the planned man-hours were too optimistic.
If disruptive events have occurred, the notices sent to the client in relation to those events must be located in order to increase the likelihood of success.
The fourth step is to determine the variance between the actual and earned curves for the periods where disruptive events have been identified. If disruptive events are found in periods where there is no significant variance between actual and earned hours, it should be investigated whether acceleration or recovery measures were implemented. Those acceleration measures may have been affected by an event and may not have achieved the intended result. In such cases, the supporting documentation for the measures taken must be located and the expected productivity improvement must be calculated in order to quantify the consequences of the event.
In most cases, the contractor claims that the effect of the events that occurred on the project is equal to the delta between the total planned value and the actual value. This could be interpreted as a global claim with no cause-and-effect argument.